
Erosion of the Holderness coastline
By Jennifer Winnard-Sivill

GIS and remote sensing
What is GIS and remote sensing? And how are they used?
Remote sensing is defined as gaining knowledge from distant objects (Campbell, 1996), “recording, observing and perceiving objects from a faraway place” (Crisp.nus.edu.sg, 2016). Instruments are used to aid vision and record information such as telescopes, cameras, aircrafts, satellites and hot air balloon where remote sensing was initialised, these instruments are labelled sensors. Such sensors measure the reflected electromagnetic energy (visible light or infrared) from features on earth’s surface. The reflections are measured in wavelengths each corresponding to a given colour or shade, further collected and analysed. An image consists of several bands or layer, each representing a part of the electromagnetic spectrum showing specific information.
“Remote sensors can either be passive or active” (Oceanservice.noaa.gov, 2016). Passive sensors record natural energy, such as the suns emitted and reflected energy, which can be known as optical sensing with thermal, near infrared and visible light. With the use of optical remote sensing a true and false colour composite image can be produced. A false colour composite creates an image unconventional to what is seen by the eye as it includes and infrared band. For example the colour of vegetation or concrete are not the colours they are seen to be, instead they could be blue or red. Whereas a true colour composite uses a combination of 3 bands, red, green and blue which are visual primary colour bands displaying an image which is presented the same as a human would see an area.
Active sensors are different as they don’t use natural energy; active sensors use lasers and other sources. Lasers are emitted projecting onto the earth’s surface with the time taken for the energy to be reflected.
After the information is recorded, data is displayed using raster data where information is shown with the use of grids. Each pixel has a number referring to a colour to create an image, the smaller the pixel size the more information it can display making it more reliable and representative of the area studied.
GIS or geographical information system is designed to capture, store, analyse, manage and present data referring to a spatial location. GIS displays the shape and structure of the earth’s surface, representing rea world images with digital data. Remote sensing is important to GIS ad it captures the information which is further used to analyse using GIS. The resources and programs used are ArcMaps, ArcCatalog, ArcGIS and ERDAS. Real world objects are divided into 2 categories, discrete objects such as houses or buildings and continuous fields like the elevation or rain. Additionally there are 2 types of digital data stored in GIS, first is raster data using cells/pixels where each pixel has a number corresponding to information and a colour and finally there is use of vector data where information is stored in plot dots. Georeferencing is used with GIS data, whereby images can be place on top of each other or side by side if the location of the pixel is known. Georeferencing allows images to be placed on top of each other so a change can be seen or if they are placed near each other, an image can be created of the area studied.

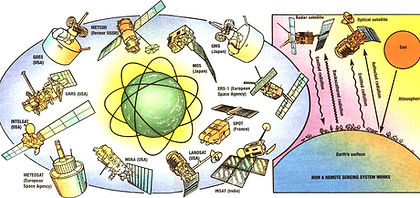
Figure 6: A range of remote sensing devices.
Figure 7: How remote sensing works.
Why use GIS and remote sensing?
GIS and remote sensing is used within this investigation as data and information is easily accessible and represented from many sources allowing a vast amount of information to be analysed. Data from the past can be compared to those of the present so a change in the coastline can be displayed. Information from different sources can be plotted on one map or image allowing all the data to be shown at once. Files can be created to shows the focus area and where it is located within the UK or other countries. Historical information can be collected and displayed showing what areas used to contain and how they have changed overtime. The census collects information on population and what the land contains e.g. leisure centres, banks etc. this can all be shown on a map with the use of remote sensing and GIS to present information now and from the past. Remote sensing and GIS has many more features that are used within this investigation to allow a range of information to be collected and displayed.

Figure 8: Description of GIS.
Figure 8: Description of GIS.